INFRARED THERMOGRAPHIC ANALYSIS OF SNOW SKI TRACKS
Charles C. Roberts, Jr., Ph.D., P.E.
Consulting Engineer
Big Rock, Illinois, USA
ABSTRACT
The temperature rise distribution in a snow ski track yields information
on the performance of the ski. High temperature rise indicates high pressure
such as an edged ski while low temperature rise indicates less pressure such as
a gliding ski. Preliminary research is performed on snow ski tracks using
infrared thermography. Several thermograms are presented showing the temperature
rise in ski tracks on a motorized ski deck and on a ski slope. Temperature rise
(about 7C) was easily acquired on the motorized ski deck because of the high
coefficient of friction between the ski and ski deck nylon carpeting.
Temperature rise on the ski slope was much lower (about .3C) and much more
random because of snow surface variations. Preliminary results indicate that
infrared thermography can be developed into a useful tool by the snow ski
designer.
INTRODUCTION
The interaction of the snow ski with snow is of considerable interest to
ski designers. Coefficients of dynamic and static friction, pressure
distributions and plastic deformation of snow are a few of the parameters
investigators analyze when researching ski/snow interactions. Of particular
interest is the analysis of ski resistance while on the snow. Various ski
shapes, base designs and wax recommendations have evolved from testing of a
multitude of skis. Typically this testing involves the use of the equipment in
racing, engineering tests on specific sub assemblies and on slope testing by
experienced skiers. Another technique for analyzing ski/snow interactions is
infrared thermography. Infrared thermography is a technique of acquiring
infrared radiation and displaying this information on a TV like screen showing
thermal patterns. This technique has been researched in other areas of skiing
technology as detailed in References 1, and 2. The basic thrust of this research
is to explore the usefulness of infrared thermal imaging of snow skis gliding
over snow. The temperature rise in the snow from a ski is a result of frictional
energy dissipation as well as plastic deformation of the snow from compacting.
The temperature rise therefore can be another way to assess snow ski performance
during the design process.
This research involves thermal analysis of snow ski tracks using infrared
thermography. Six tests were performed resulting in thermal images of snow ski
tracks. A representative set of thermal images is presented from one test. A
single skier with a total weight (equipment + skier) of 70.4 kg (155 lbs.) was
used for testing. One snow condition was analyzed. The snow was packed with a
temperature of approximately -5C.
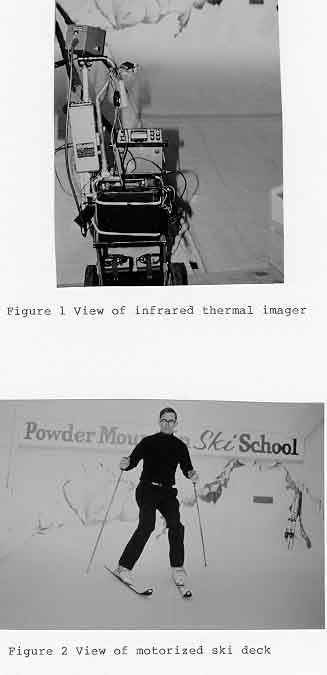
INFRARED THERMOGRAPHY
Infrared thermography is the science of detecting infrared radiation,
processing the infrared signal and displaying it on a TV like screen. Figure 1
is a view of the infrared thermal scanner used in this research. The infrared
detector is sensitive to the 8-14 micron wavelength band in the infrared. The
output is a standard videotape that can be colorized and converted to thermal
images called thermograms. The scanner system is portable and can be taken on a
ski slope. Figure 2 shows a motorized ski deck with a revolving nylon carpet.
The speed of the carpet matches the descending speed of the skier so thermograms
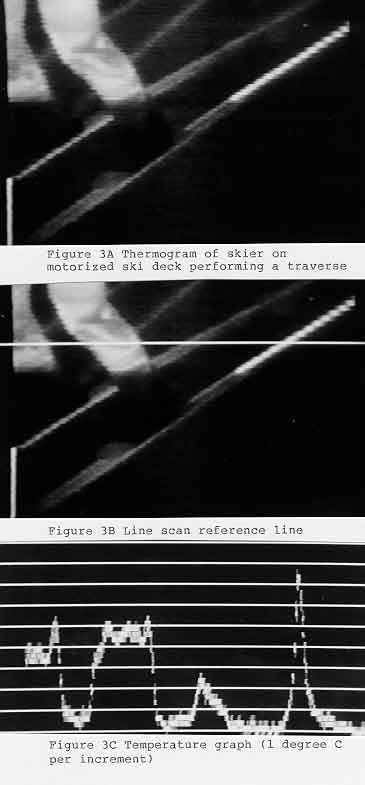
can be taken without moving the instrument. Figure 3A is a typical thermogram of
a skier, which in this case is skiing on the motorized ski deck shown in Figure
2. Dark areas indicate lower temperatures while brighter areas indicate higher
temperatures. The emissivity (ratio of the radiation emitted from the object
viewed to that of a black body at the same temperature) of objects in the scene
may also have an effect on the brightness or darkness of the object. In Figure
3A the white line is the line scan function where a line scan reference line
defines a temperature graph shown in Figure 3B. This function helps quantify the
light and dark areas on the thermogram.
PRELIMINARY TESTING ON A MOTORIZED SKI DECK
Preliminary testing was performed on a motorized ski deck because of the
easily controlled conditions indoors and the uniformity of the surface. Figure 2
shows the motorized ski deck with nylon carpeting used at the skiing surface.
The coefficient of dynamic friction (at 1 m/second) is approximately 0.2. The
coefficient of friction between the carpet and ski is higher than expected on
snow but is typical of a nylon carpet and polymer base ski interface. This high
coefficient of friction yields high temperatures in the carpet, which are easily
detectable. However the high friction also causes the skier to lean backward
more when compared to typical snow conditions. Figure 3A is a thermogram of a
skier in a gliding traverse. The flaring or high apparent temperature trace on
the left ski is the temperature rise in the carpet as a result of frictional
energy dissipation in the carpet. As the ski travels over the carpet the
frictional energy dissipation increases the carpet temperature along the line of
travel of the ski. Tests with a cold ski show little difference in carpet
surface temperature when compared to a ski warmed by the carpet frictional
energy dissipation. In Figure 3A the line scan reference line is used to define
an apparent temperature trace in the thermogram. Figure 3B is the temperature
distribution along the reference line. As shown in Figure 3B the high
temperature rise peak at the right of the thermogram (arrow) is the temperature
rise of the ski track above carpet ambient temperature. In this case the
calibration of the graph is 1C per division with a total temperature rise of the
ski track of approximately 7C. The emittance of the carpet is near unity. The
temperature rise in the carpet decreases over time due to thermal energy
dissipation to the air and carpet base. The temperature distribution along the
ski track is characterized by the highest temperature at the ski tail decreasing
uniformly to carpet ambient temperature. It should be noted that temperature
differentials were measured and not the absolute temperature of the skiing
surface.
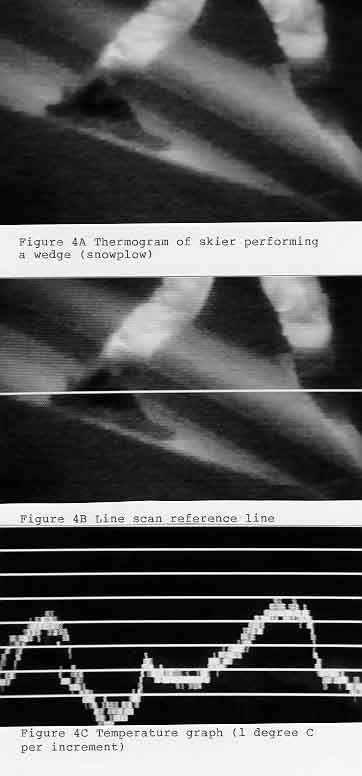
Figure 4A is a thermogram of skidding ski (wedge or snowplow) showing the
energy dissipation along the path of travel. This pattern is more diffuse since
the energy dissipation is over a wider area when compared to the gliding
traverse. As expected the peak temperature rise is lower than that of the edged
ski and is approximately 3.5C above the ambient carpet temperature (Figure 4B,
arrow).
This preliminary research was performed to act as a guide for the on snow
experiments.
TESTING ON SNOW
Unlike the relatively isotropic carpet, a snow surface on a ski slope is
typically characterized by terrain variation, snow density differences and
changes in snow depth. Another complication involving temperature rise
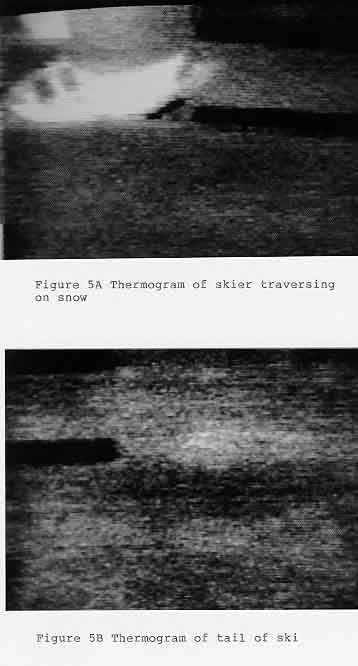
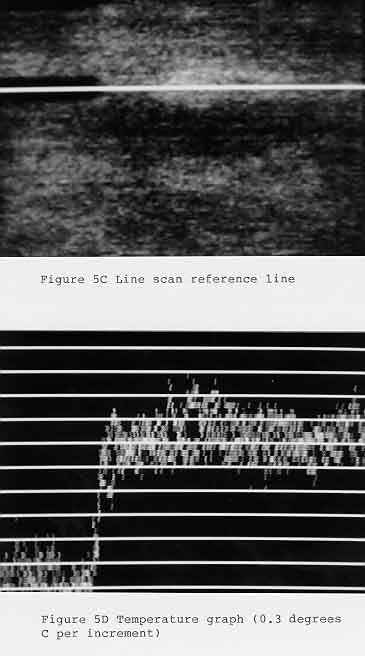
measurements on snow is variation in snow surface emissivity. Figure 5A is a
thermogram showing the ski tail exiting the picture at the left. The ski surface
is actually reflective and is reflecting the sky temperature, which is colder
than the snow surface temperature, which was approximately -5C. The skier is
gliding on the snow with the ski flat. The ski hill is a uniform slope with a
pitch of approximately 10 degrees. The snow was groomed by a power tiller. The
snow temperature was approximately -5C. The light area behind the ski is the
temperature rise of the ski track on the snow (arrow). The coefficient of
dynamic friction of the skis used in the study was approximately 0.05 at 1 meter
per second. This was performed by towing the skier on a flat snow surface using
a dynamometer to determine the towing force at a speed of 1 meter per second.
This bright area disappeared within seconds after the ski passed as the snow in
the ski track equilibrated to surrounding snow ambient temperature. Figure 5B
shows the line scan reference line, which is located along the direction of
travel of the ski. The calibration of the line scan temperature graph is
approximately 0.3C per increment. The temperature rise appears to be on the
order of one increment or about 0.3C (Figure 5C, arrow). Note that the apparent
temperature drop to the left of the temperature trace is the snow ski reflecting
the cold sky temperature. The temperature distribution along the ski track
appeared characteristic of a random process and is less consistent when compared
to the nylon carpet. The temperature trace often appeared like a sinusoidal
decreasing function rather than the uniformly decreasing temperature function of
the carpet testing. This may be due to snow density and crystal variations along
the ski path. Areas of higher density that may not compact readily as the ski
passes may tend to support more pressure and result in localized increased
frictional energy dissipation.
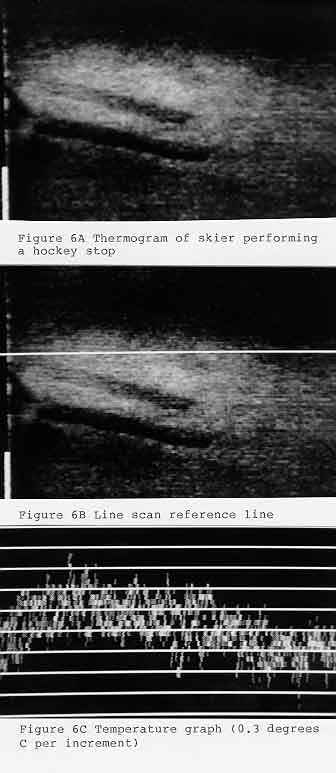
Figures 6A and 6B show the result of a test where a skidded turn ending in
a hockey stop was performed. In Figure 6A the light area is the temperature rise
in the snow near the tails of the skis (arrow). The temperature rise shown in
the graph of Figure 6B is approximately 0.6C above the ambient temperature.
Figure 7 shows typical temperature rise distributions observed during
several tests. The motorized carpet tests resulted in temperature rise readings
as high as 7C, which decreased monotonically as the distance from the ski
increased. The on snow temperature rise distributions were less well behaved and
tended to be characterized by decreasing sinusoidal functions. The random
characteristic of snow density and slope pitch variation can explain the
difference in the two distributions. This suggests that although the motorized
carpet is a good platform for analyzing the dynamics of a snow ski in an ideal
environment, the on snow condition is different because of the reduced friction,
snow density variation, terrain variation and the effect of compacting snow. The
maximum temperature rise value observed in the snow was typically 0.6C. The snow
testing was performed on cloudy nights with snow temperatures on the order of -
5C. The emissivity of the snow was approximately 0.80. The snow surface had been
groomed by a power tiller.
CONCLUSION
Infrared thermal imaging of snow ski tracks both on a motorized carpet and
on the snow show the results of frictional energy dissipation. The temperature
rise in the motorized carpet tests appeared to be proportional to the degree of
ski edging. This is useful to ski designers in that the effect of ski parameters
such as ski stiffness, ski shape (side cut) and waist location can be assessed
with a view toward the ski/snow surface contact.
Thermal images of energy dissipation in the snow were detected. The
apparent temperature rise was quite low and typically less than 1C. The
temperature rise in the ski track immediately after the ski had passed appeared
non-uniform over the length of the ski track. Variations in snow density and
snow surface condition are likely contributors to the temperature rise non-
uniformity.
It should be noted that this is preliminary research. Much more work
remains regarding using the infrared technique with varying snow conditions,
different skier weights and ski designs.
REFERENCES
1. Roberts, C. C., Jr., Infrared Thermal Imaging and Skiing Safety, Skiing
Trauma and Skiing Safety: Fifth International Symposium, May 1983, p.445-463.
2. Roberts, C. C., Jr., Analysis of Thermal Patterns on a Motorized Ski Deck,
SPIE Vol. 780, Thermosense IX, 1987, p.188-193.
 BACK TO ROBERTS SKI AND SNOWBOARD INSTRUCTION HOME PAGE